19 Oct
[ad_1]
By: Rachel Frnka
Am I the only one who thinks blogs were in their prime in the mid-2010s, before the internet began consuming content at wicked fast rates (thanks, Instagram and TikTok)? When someone says the word blog, I think of the chokehold 2015 southern American female fashion bloggers had on the internet. Pure pumpkin spice latte fashion. And though those blogs have, probably for the best, slipped away from the limelight, blogs are still alive and well. Maybe this is because my definition of a blog was much narrower before I began collecting data for this post.
In fact, ranking lists on the internet seem to have an open interpretation of what a blog is and rank some of the most well-known sites on the internet. Because of this, I’m sure you can imagine the performance for these 50 websites was a little diverse. So from tech to fashion and pop culture, let’s dive into the web performance of these publications.
The Data and How We Tested Web Performance
Back in the day (and we mean back), we relied on a list of the biggest 100 blogs from Technorati. This list has been retired. So in lieu of this list, we found an amazing ranking of the best 50 blogs from Detailed, which is ranked algorithmically every 24 hours.
For each website, we ran its homepage through our SolarWinds® Scopify® Speed Test to collect data about how fast it loaded, how big the homepage was, and more. Today more than ever, websites need to be up, fast, and always working correctly 100% of the time—a bad moment could mean lost readers, advertising revenue, or subscribers. We ran our tests on September 27,2021, from our Washington D.C. poller. Why D.C.? No real reason—it’s just one of the many polling locations we have to test from.
Setting Benchmarks
The internet has changed since our 2016 post, but let’s see how much web performance for the top blogs has (hopefully) improved. The average stats from 2016 were as follows:
- Average homepage size: 4.92MB
- Average homepage load time: 5.48 seconds
- Average number of requests: 367 requests
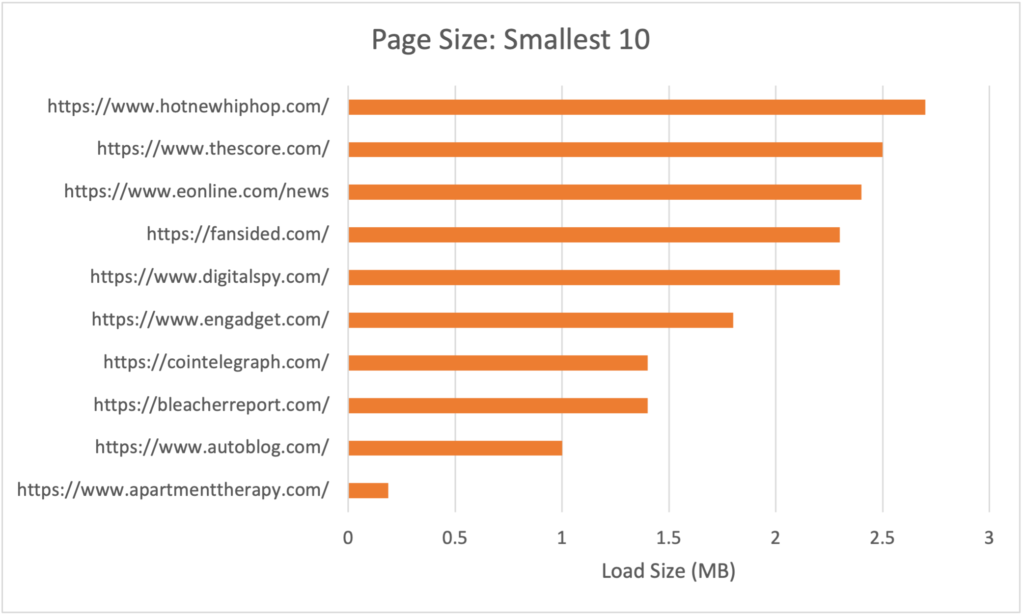
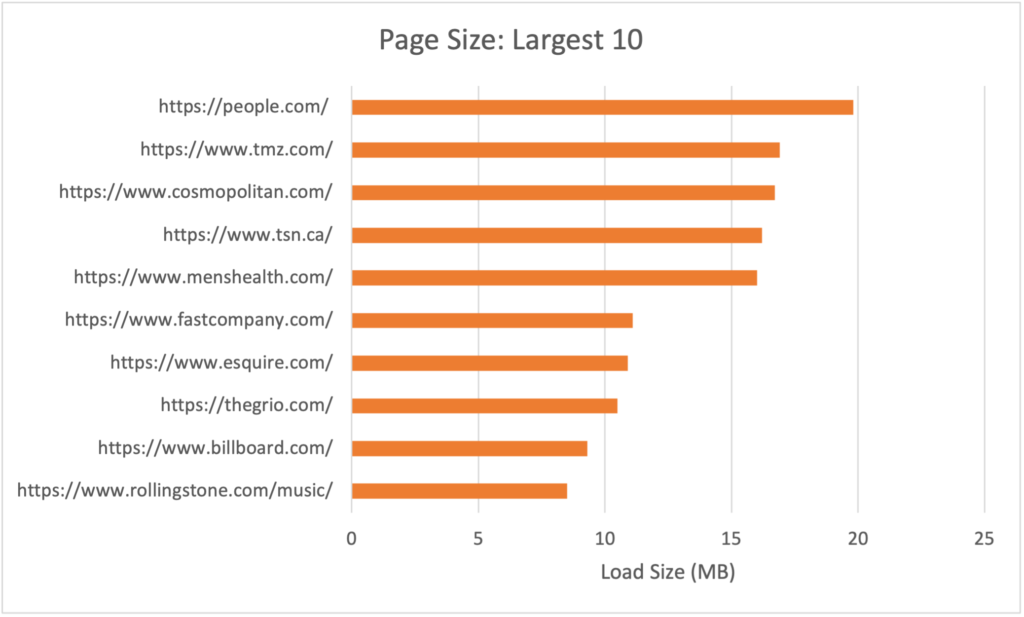
Page Size Varied From 0.187 to 19.8MB
A large span of page sizes isn’t surprising. These sites could be text-, image-, or video-heavy and most likely change often. The smallest homepage—Apartment Therapy—tests in at 0.187MB, greets you with a large image taking up most of the screen above the fold, and is a clean design. This is different from People, which weighs in at 19.8MB, with video advertisements above the navigation and a compilation of articles and images.
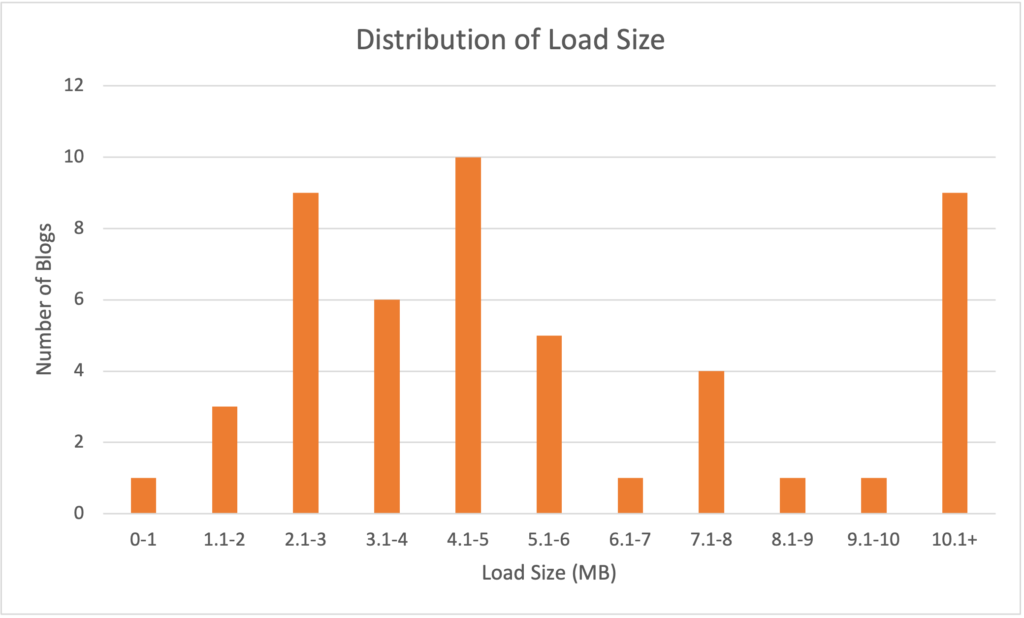
Since 2016, page size has increased and now averages 5.9MB. However, it’s important to note 35 of the 50 top sites are below this average.
In the following charts, you can see the top and bottom 10 blogs in terms of homepage size:
Here, it’s easy to see why the average is inflated to 5.9MB—these 10 sites were way over the average.
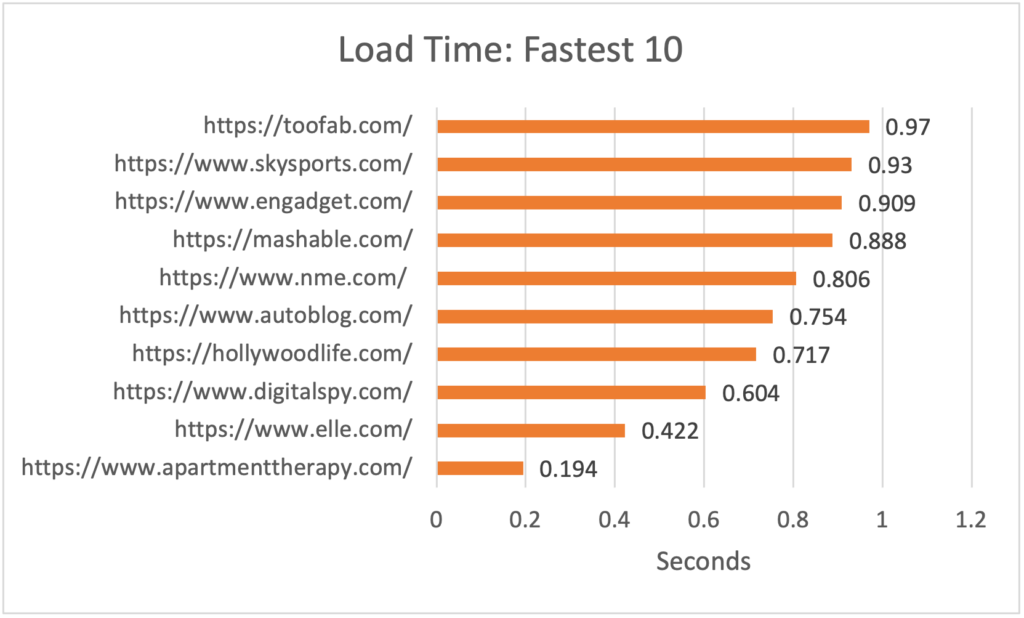
11 Homepages Loaded in Less Than One Second
Is it a surprise the fastest-loading website—speeding in at 0.194 seconds—is also the smallest homepage? That’s right, Apartment Therapy is small and fast.
Meanwhile, Elle was the second fastest homepage (0.422 seconds) and was the last site under the 5.9MB average page size threshold.
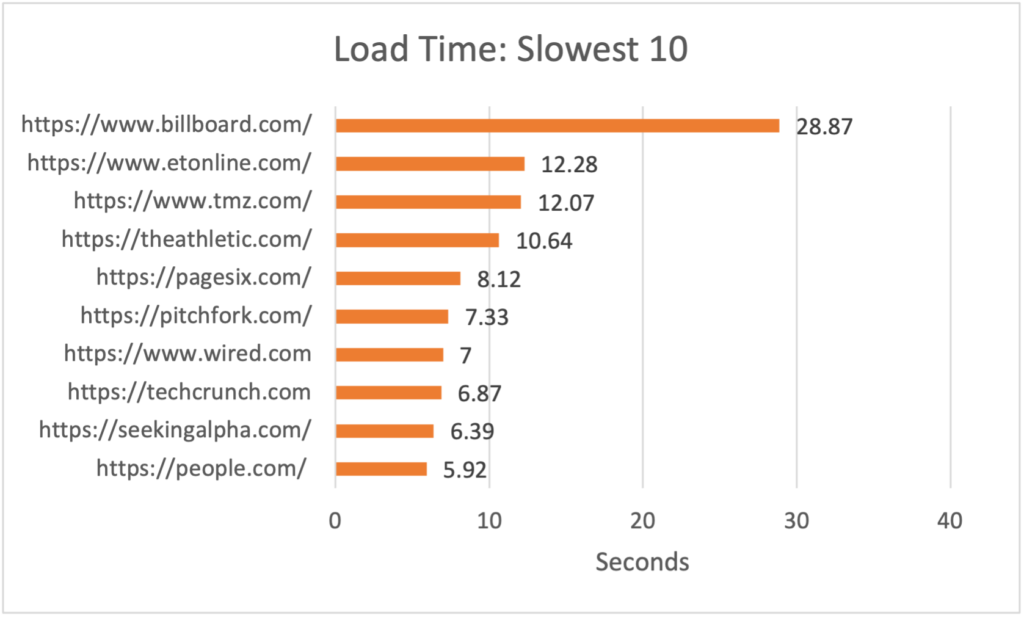
Would you wait almost 30 seconds for a website homepage to fully load? By the looks of it, the slowest 10 loading sites would have us bouncing. Would you wait?
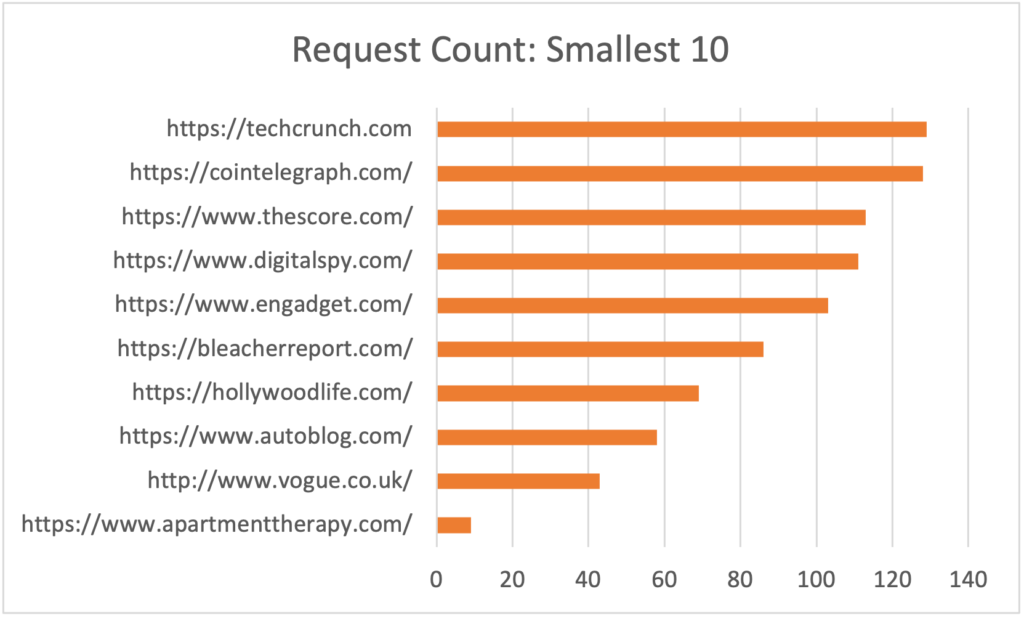
Requesting the Most of Every Page
Many elements make up a webpage, and having more elements tends to mean more HTTP requests. These include JavaScript files, CSS files, images, etc.
The average number of requests has fallen slightly to 333 requests, but 22 of the sites were above the average, with TMZ topping out at 930 requests.
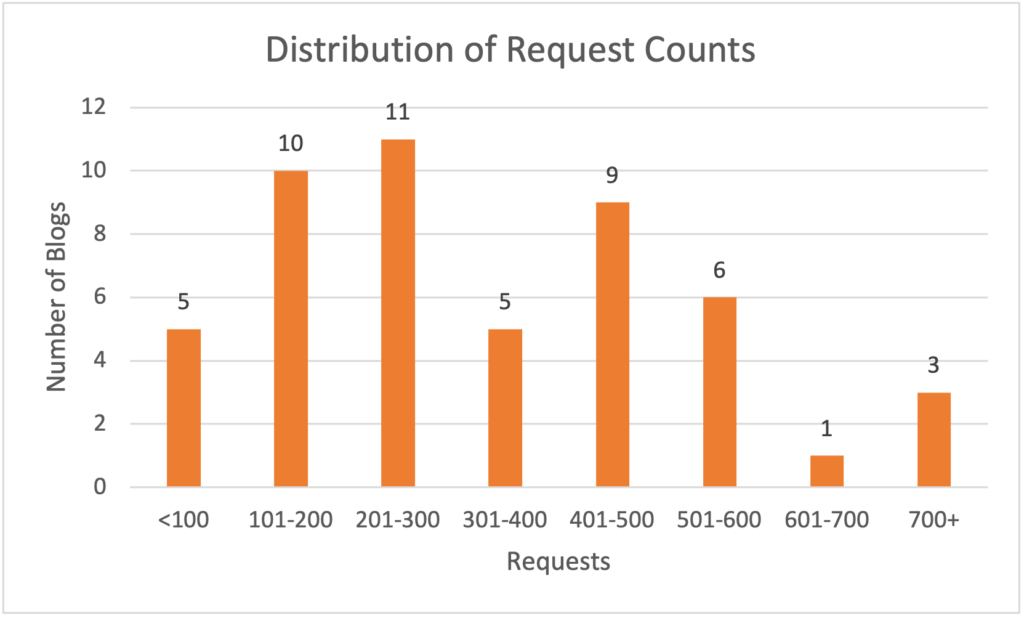
Only one of the 10 smallest request-count homepages—TechCrunch—was above our average load time of 3.9 seconds. Six of the other smallest request-count pages loaded in under a second! This shows how important it is to not only limit requests when you can but to optimize the requests you do have.
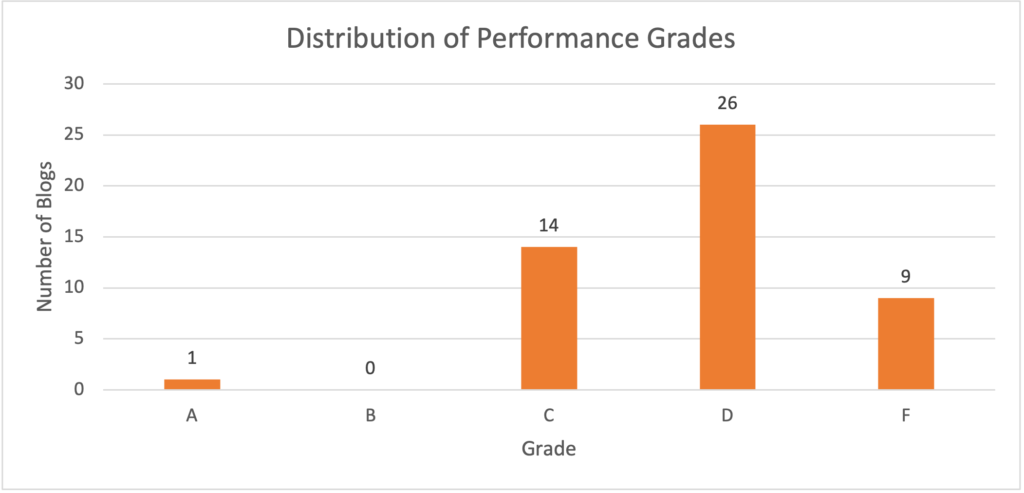
Final Grade
The scores follow the performance best practices of YSlow, and while there was an “A” grade awarded, the average grade was a “D.”
Plenty of Room for Web Performance Optimization
Chances are you visit one or more of these sites on a regular basis. Does their web performance affect which ones you return to more often than others? The speed of a site plays a major role anywhere you want to sell something, this much we know.
We certainly find it interesting to dig into web performance data like this to get a sense of how these top sites function and what kind of experience you might have when you visit them. Even though the results are mixed, one thing is certain: there’s a lot of room for optimization in many of these popular blogs.
Please run your site through our Website Speed Test and see how it compares with the benchmarks mentioned here. You can run an automated performance test every 30 minutes on our dashboard when you sign up for a 30-day free trial.
[ad_2]
Source link