[ad_1]
Modern software applications involve multiple layers of code and services, working together to meet increasingly demanding user requirements. To achieve this, systems became distributed, providing improved scalability, fault tolerance, and complexity. However, this innovation brought new challenges to basic troubleshooting and performance monitoring to maintain the health of systems. It’s for these reasons that observability is trending.
Observability is the pursuit of understanding a system’s internal state solely through that system’s outputs. It involves the instrumentation of different components of an application to output telemetry data—logs, metrics, and traces. When a system is observable, an engineering team can determine the state and health of that system at a glance.
Among the multiple components and layers in an application are those near the top of the stack, known as the front end or user interface (UI). These components are most directly related to user experience. They are web applications or products that users interact with. The outputs from these components are key inputs for an observable system.
In this article, we’ll discuss important user experience metrics, different solutions for monitoring these metrics, and what they mean for a holistic application observability experience.
What Are the Important User Experience Metrics?
Traditionally, the backend of a system stack would include metrics for telemetry data, such as CPU usage, memory usage, and network throughput. Front-end applications have a similar list of metrics that are key to forming a detailed level of observability into a system. Some of these important metrics include:
- Uptime: The overall application availability to your users, typically measured as a percentage of total time online.
- Time spent on a page or site: This metric describes the time a user spent actively moving around your application, ending when they navigate away to a different portion of the website or URL.
- Page views: The total number of times an application is viewed, measured over a selected time period.
- Page response speed: This metric measures—in seconds or milliseconds—the load time for your application to display meaningful content on the frontend. The user can see and interact with this content. This speed is usually rated as low, average, or high.
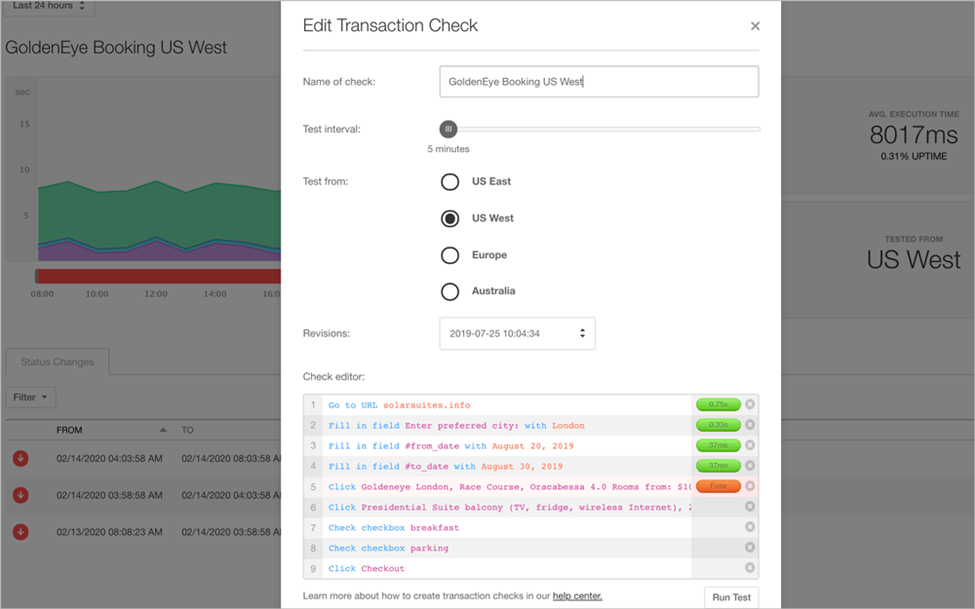
- Transaction efficiency and usability: A transaction is a set of steps a user executes to complete a task, such as purchasing an item from an ecommerce store. From the user landing on the page to completing the purchase, this entire process is considered a transaction.
- User platform/device type: This data provides a breakdown of a user’s device by the operating system, browser, and type (mobile/desktop). This information can also include more succinct metrics like screen size and other device capabilities.
- Geographical area: This information covers the global area from which a user is making requests. While this is often by region or country, it can be more granular.
- Task success rate: Displayed as a percentage, this number describes the successful completion rate of user-requested actions.
- Error rate: Also shown as a percentage, this number describes the rate of user actions leading to errors.
- Device performance monitoring: Many different devices can interact with an application, such as mobile, desktop, or laptop. Device performance monitoring gives teams information on how well a particular device can handle running the requested application.
How Do We Capture These Metrics?
The first method of capturing user metrics is Real User Monitoring (RUM). RUM gathers data on user interactions in your web application. It reports data like navigation start, request speeds, and other metrics. This type of monitoring requires both client-side and server-side integration to function properly. These are software libraries installed alongside system code integrated deeply within the underlying parts of this system, reporting this information to another system where it is gathered and distributed.
Synthetic Monitoring (SM) is a process in which scripts interact with your application. You use these scripts to simulate user interactions with a system, testing the key parts a user would likely interact with. As an SM tool mimics transactions, an engineering team can monitor application performance, such as functionality, availability, and response times. SM helps teams establish baselines for how an application should perform over time, constantly testing the application in a deployed environment.
Combining RUM with SM gives a business live information about how a system is performing and automated testing on the system at all times. This can be crucial for off-peak times when business teams typically perform major updates or other maintenance that may cause issues later.
What Are the Shortcomings of the Traditional “Monitoring” Approach?
Like RUM and SM, traditional monitoring provides valuable performance tuning. For example, if a page response speed is significantly slower for users in Asia than it is for users in South America, then it may signal the need to add a CDN node in Tokyo. These types of monitoring also help identify the root causes of issues raised by end users.
However, traditional monitoring solutions are only reactive solutions to system issues. They help engineers and support teams identify and resolve problems after they have occurred and your users have been impacted. Ultimately, in the modern world of web-based applications, when a user notices an issue, their trust in your product and confidence in your application are already affected.
It’s important to understand that a traditional monitoring approach means being constantly engaged with how your system is performing. However, in highly distributed and complex systems, monitoring is no longer enough. Traditional approaches to monitoring can create more noise and more data for teams to investigate. For engineering teams, meeting the changing demands of systems and users requires solutions designed to report problem states before they result in failures. For this, you need observability.
What Are the Benefits of Fueling Observability with These User Experience Metrics?
Many people use observability and monitoring as interchangeable concepts, but there are clear differences between the two. As mentioned, monitoring is a reaction to system state changes, logged errors, or system failures.
Observability utilizes artificial intelligence, machine learning, and user engagement to identify trends and situations that can lead to increased error rates within your software systems. Although observability tools still take inputs from RUM and SM, they can actively analyze this input, notify teams of the early signs of an imminent outage and predict the user sets that will be affected.
The observability system identifies issues and notifies teams to fix the problem before your user base notices. When a system goes into an unhealthy state, observability gives teams more information about why an issue occurs. This information is easily digestible through dashboards and other visualizations from the observability platform enabling teams to better identify relationships between problem parts of a system.
This observability output is then automated into the software system to create opportunities for self-healing systems. Observable systems can detect or reroute slowdowns to maximize user experience, so teams spend even less time putting out fires and more time hardening the system.
Conclusion
However, each moving piece in a distributed system introduces a new layer of complexity and potential points of failure. Traditional monitoring methods are reactive, and they only facilitate some performance optimization. By using metrics with application observability platforms, teams can detect and resolve issues before users notice service interruptions or delays.
Engineering teams can anticipate user experience issues beforehand, actively improving the experience while gaining a holistic view of the entire system. Proper observability gives your application an edge in the competitive internet landscape, helping you to deliver user experience and service reliability. Interested in collecting user experience data? Start a free 30 trial of Scopify today
[ad_2]
Source link